I’ve been putting it off for a while, but with my recent trip to GDC and the arrival of the Direct3D 11 beta, I thought it was about time I switched my renderer to be multithreaded. One of the things I learned at a Direct3D 11 talk at GDC is that it works on ‘down-level hardware’, which means DirectX 9 & 10 cards. Of course, you don’t get the snazzy new hardware features, but you do get some of the benefits of the new API, like multithreading and limited compute shaders (albeit not as fast as it will be on the real hardware).
There has been some multithreading support in earlier DirectX versions for a while now by using the multithreaded flag when creating the device. Typically though, the pattern has been to run a dedicated rendering thread and submit objects to be rendered to that thread. This allows the device to stay in single threaded mode where it is faster.
Things have changed a lot with Direct3D 11. The rendering API has been separated from the factory functions into a separate object called the device context. The factory functions on the device are all free threaded, meaning that they can be called from any thread. The device context functions are designed to be called from the same thread.
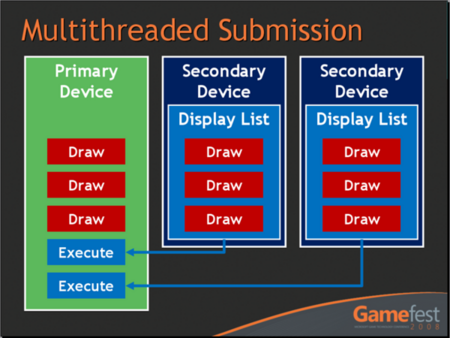
The basic idea behind multithreading in Direct3D 11 is that you create an immediate device context on the main thread. Then, for each thread on which you’d like to be able to render, you create a deferred context. As you can probably guess from the names, commands executed on the immediate context get executed immediately, but those on the deferred context just get saved off into a command list. You then execute the deferred command lists on the main thread using the immediate device context. Sounds easy enough.
Thread Pools
Given that you can submit draw calls to deferred contexts on multiple threads, it makes sense to ditch the single rendering thread concept and switch to using something like a thread pool for issuing the draw calls. This scales far better than a dedicated rendering thread. It’s also pretty easy to set up a simple thread pool, and give each worker thread a deferred render context.
There are plenty of places on the internet to read about thread pools so I’m not going to get into it here, but one thing I can’t stress enough is to make sure that you get your synchronization right! In my initial implementation, I used my normal queue data structure, but wrapped it up in mutexes (mutices?) to make sure it was thread-safe. This worked out well since I was very confident that things were working correctly, but a quick foray into VTune told me that I was spending 40% of the time waiting on synchronization points!

After some quick digging around, I came across a few articles that Herb Sutter wrote for Dr Dobb’s Journal about producer/consumer queues. I implemented the low-lock queue recommended by Sutter, and got a good speedup of at least 30% (that number is off the top of my head, but I remember it was a lot). The relevant articles I read are single producer/consumer queue, generalized concurrent queue, and measuring performance. I still use events for sending the worker threads to sleep when there is nothing left to work on, and to wake them up when data is added to the queue.
My application already stores up all of the state needed for a draw call in an object called a RenderContext, so instead of passing off this render context to the renderer on the main thread, instead it just gets enqueued to be rendered by one of the threads in the thread pool. When the worker thread gets to it, it passes the render context off to a thread-local renderer object initialized with a deferred device context. This renderer sets all of the changed state and issues the final draw call.
Finally, back on the main thread, it waits until all of the render contexts have been submitted to the deferred device contexts, and then executes each of these on the immediate device context.
Test Scenario
In order to stress my renderer a bit, I fabricated a scenario with 10,000 models. Each model has a sphere and a ground plane with their own material. I use a loose octree for culling out the models outside of the frustum, but I don’t do any sorting of any kind. This means that the alternating materials that get rendered for the sphere and then the ground put a fair amount of stress on the CPU side of the renderer.
My single threaded renderer took about 50 ms to render the intial view of the scene. By switching to using the thread pool, this went down to about 30 ms. A nice improvement, that’s for sure. Obviously, as fewer objects are visible, the gains of using the multithreaded renderer disappeared.
Profiling
I was happy that the multithreading appeared to be doing its job, but I wasn’t quite satisfied because I couldn’t really tell how well it was doing. Time for some profiling!
There appear to be quite a few CPU profilers out there. First of all I downloaded an evaluation of Intel VTune. It’s pretty overwhelming, but it gave me a lot of pertinent information. The bugger is that you have to pay a hefty sum for it, so I tossed it out of the window. I also tried out Microsoft xperf. This sampling profiler gave me a pretty good overview of what was expensive with the standard inclusive/exclusive view. It was a great help for quickly tracking down some areas of the code that I could very easily improve. I still use this.
The trouble with most of the sampling profilers is that they don’t know about frames. They just add up all of the samples over the given time period which gives you an idea on average what is happening. I wanted to get information about what was happening within the frame, so I implemented a really simple frame profiler.
Frame Profiler
An in-game profiler is a really handy tool to have. It lets you see in real-time exactly how your CPU time is being spent in one frame on each of your threads. It’s also pretty easy to set up.
First of all, I created a class called ThreadProfiler. As the name suggests, the ThreadProfiler class is responsible for recording events on a specific thread. This class has functions to notify it of the beginning and end of the frame, as well as when a profiling event begins and ends. All it really does is to record the name of the event, a color for display, and the timestamps when the event begins and ends. The events can be nested, so it maintains a stack of active events and records the depth of the stack for each event.
Next I created the singleton FrameProfiler class. The idea for this class is to hold all of the ThreadProfiler objects, and to forward events onto those classes based on the current thread ID. Threads are required to register their thread ID with the frame profiler in order for events to be recorded.
class FrameProfiler : public Core::Singleton<FrameProfiler> { public: FrameProfiler(); void RegisterThread(int threadId); void BeginFrame(bool enabled); void EndFrame(); void BeginEvent(int threadId, const Core::String& name, uint32 color); void EndEvent(int threadId); DataStructures::ArrayList<ThreadProfiler>& GetThreadProfilers(); const DataStructures::ArrayList<ThreadProfiler>& GetThreadProfilers() const; private: DataStructures::ArrayList<ThreadProfiler> m_threadProfilers; };The final piece is a really simple macro which grabs the function name and creates an object which tells the FrameProfiler when it is created and destroyed. This is the macro that I place into whatever function or loop I’d like to profile.
class ScopedProfileEvent { public: ScopedProfileEvent(const Core::String& name, uint32 color) { if (FrameProfiler::IsCreated()) { FrameProfiler::Instance().BeginEvent(Core::Platform::GetCurrentThreadId(), name, color); } } ~ScopedProfileEvent() { if (FrameProfiler::IsCreated()) { FrameProfiler::Instance().EndEvent(Core::Platform::GetCurrentThreadId()); } } }; #define PROFILE(X) const Profile::ScopedProfileEvent event__LINE__(String(__FUNCTION__), (uint32)X)Unlike a sampling profiler, this kind of profiling has a certain amount of processing overhead. There are a couple of quick things you can do to help with this though. The first is just to make sure that you don’t always have the overhead, and compile it out for your final builds. It’s important to do your profiling on an optimized build, so I would recommend debug, release, and final configurations or something similar. The second thing you can do is to just not run it every frame. I have it set on a key press so that I can get to the area I’d like to profile without the overhead, then hit the button to profile the next frame and display the results.
I’m not sure about how accurate this would be, but you could probably compare the previous frame’s duration to the profiled frame to get a rough estimate of the overhead that the profiling functions added. I wouldn’t rely on that though.
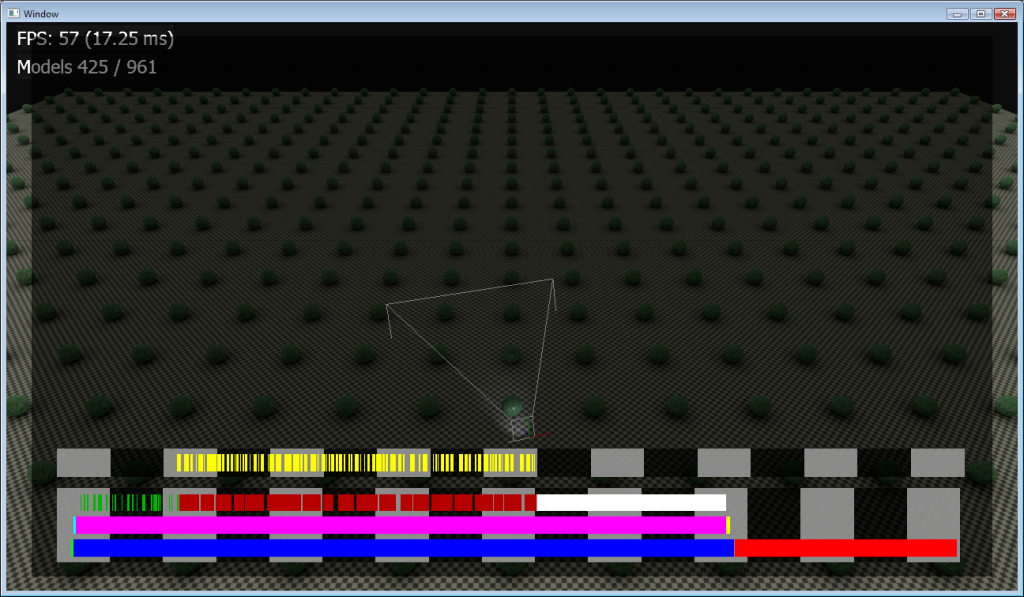
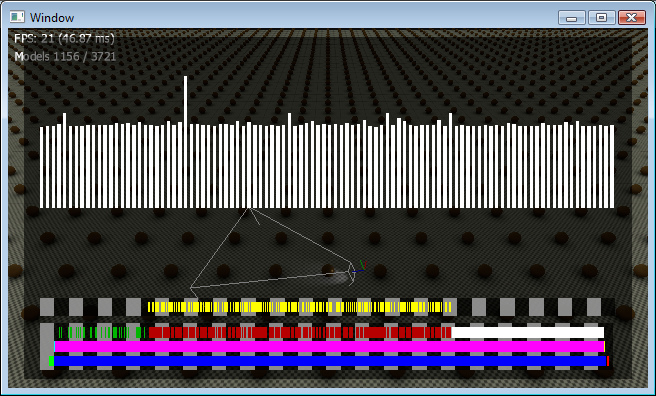
There’s actually quite a bit of information that can be gleaned from these profiling events, but the first thing I did was to render out the events as rectangles on a timeline. In the image below, I have two threads running. The main thread at the bottom has three levels of nested events being shown, and the top worker thread just has one.
Ok, there’s no legend right now, but I’m working on it. Each black/grey bar in the background represents one millisecond of frame time.
The bottom row on the main thread represents the update in green, the render in blue, and the call to Device::Present in red. Given the long red bar, I’d say I’m GPU limited in this scene.
The row above represents the breakdown of the render function from the bottom row. The cyan sliver is shadow rendering (actually I’m not rendering any shadows which is why it’s tiny). The huge magenta bar is the model rendering, and the yellow bar is post-processing.
The top row in the bottom thread represents the breakdown of the model rendering function. The green slivers are models being found in the octree and the red blocks are models being prepared for rendering. The large white bar is actually the command list from the worker thread being executed on the immediate device context. I was pretty surprised to see this segment so large, since I didn’t notice it in the other profilers at all.
Experiments
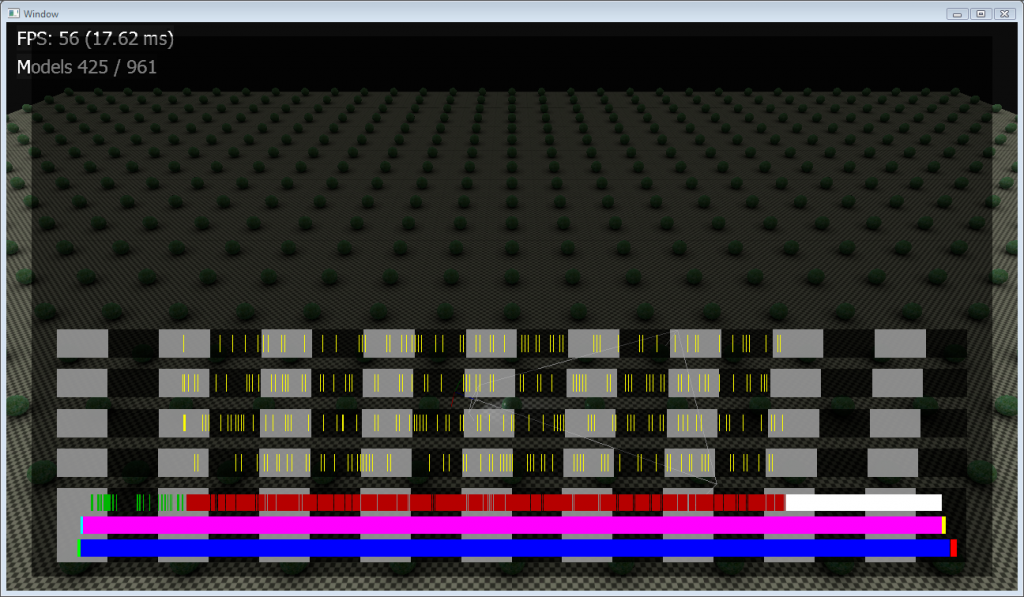
Now that I have a frame profiler, I can really experiment with my thread pool setup to see how it affects the frame. My computer has a dual core processor, so based on Sutter’s articles, I was expecting that one main thread and one worker would be the best setup. Even so, I tried running a variety of numbers of worker threads to see how it looked. Here’s what four threads looks like:
The first thing I noticed was just how much worse all of the threads fared. Each worker thread appeared to perform a tiny bit of work, and then get swapped out for another thread. The main thread really suffered due to this too. This is a great example of how visualizing this data is really illuminating. The scene was already GPU bound, so even though the rendering code was performing far worse, the frame rate actually stayed the same.
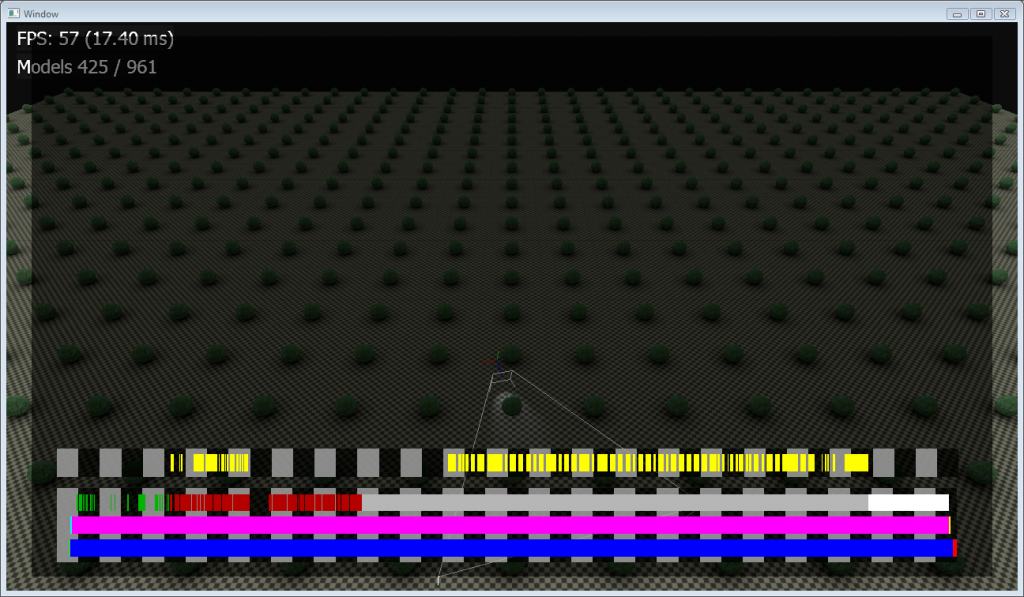
Another experiment I wanted to run was just how much other applications could affect the frame rate of my application. In this case, I just had sysinternals process exlporer running and polling the system processes every half second. It only took me a few tries to hit a frame where I could see the effect:
Notice the scale of the millisecond bars now – this frame took over twice as long to run as my first example with the exact same setup. You can see a big gap on the worker thread where another process stole its time. Event when it did get some time, it appears to be running very slowly.
Also, you can now see a large grey bar in the middle row of the main thread which shows the main thread waiting for the worker thread to finish.
The execution of the command list is pretty consistently taking up three and half milliseconds or so. This is much higher than I had thought it would be. I really hope that this time gets reduced with newer drivers or hardware.
One last thing I’ve done to investigate what is happening in my application is to display the frame rate history. I use a moving average to calculate the frame time, so I have the last 100 frames stored anyway. It’s a simple enough task to just display this.
You can see how varied the frame times are even though the camera isn’t moving. This is probably due to other processes on my computer interfering I’d imagine.
Final Thoughts
It was a fun adventure porting my code to Direct3D 11, particularly implementing a multithreaded renderer using a thread pool. I would recommend trying it out to those of you who have Direct3D 10 engines at the moment.
The jump from Direct3D 10 to 11 is nowhere near as bad as the previous jump from 9 to 10. It took me about three hours to change my rendering code to deal with the changes. The most awkward part was probably having to pass in the device context to functions which need to map buffers, since these functions are no longer on the buffers themselves.
Visualizing profiling data in real time can be a real eye-opener for understanding how your code is actually running rather than how you think it may be running. It has really helped me identify good candidates for moving to using the thread pool as well as pointing out areas of the code that are taking a surprisingly large amount of frame time.
[…] flagging technique to accomplish it. The best illustration of this I’ve found is a beautiful rendering test by game developer Rory Driscoll. Here, after explaining why DirectX’s existing multithreading support can actually slow […]
[…] up XP and pre-SP2 Vista as targets, you might be in line for some big performance benefits. I found a really nice blog post that goes into a lot more […]
[…] well written blog post by some guy, I believe Rory at High Moon […]
Very rapidly this web site will be famous among all blog visitors, due to it’s fastidious articles or reviews